How to use the True RSI Indicator
Here is how I use this for my trading.
The True RSI indicator allows me to forecast where the next potential reversal might be whenever RSI reaches that level.
Let's use an example to better understand this.
Based on the default settings, I can see that there are a few RSI settings worth looking at: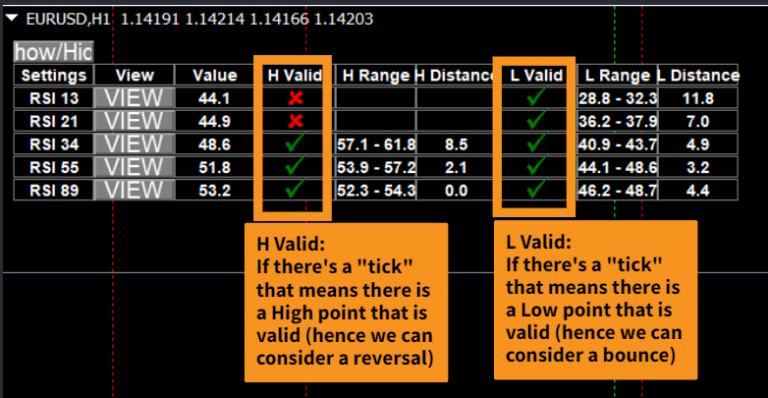
I would then click on "VIEW" to see what each setting tells me. Let's take a look at RSI 34.
We can see from the picture below that RSI bounced nicely from the 40.9 to 43.7% multiple times, or rather, 4 out of 5 times (because of our confidence level of 80%).
This allowed me to forecast the latest bounce that occured. In this example, the bounce already occured.
Take note: Sometimes the RSI indicator window might look very small. I recommend expanding it just to see where the bounces occured like I did in the picture below.
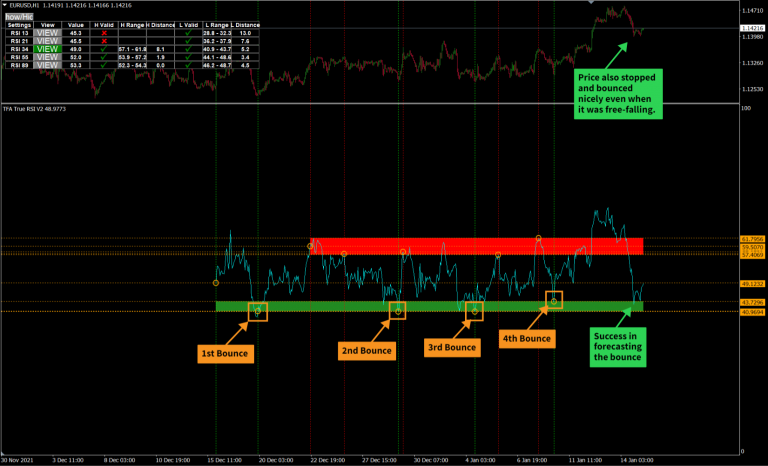
Using this information, I know that the true RSI is around the 40% range. That means the next time RSI drops down to that level, I would consider taking a trade especially if it lines up with my other analysis.
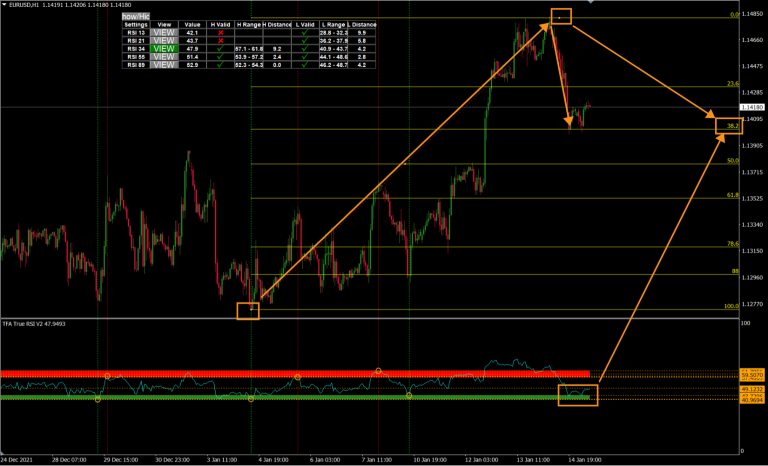
It's important to take note that the True RSI indicator works best when combined with Support & Resistance, Price Action, and especially Fibonacci.
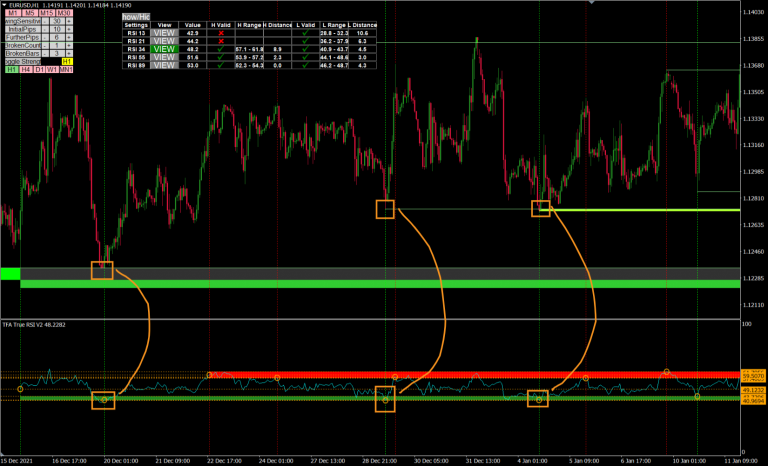
This is an example of it being combined with the support and resistance indicator:
This looks a bit messy, but there's beauty in it. We can see that the recent bounce that occured on the RSI (34) hidden support area coincides with the 34% Fibonacci retracement: